Label-free photoacoustic microscopy: super speed and super contrast
We have developed fast functional photoacoustic microscopy (ffPAM) for three-dimensional high-resolution, high-speed imaging of the mouse brain. Using endogenous contrast, ffPAM can perform high-speed, high-resolution imaging of the vascular morphology, blood oxygenation, blood flow dynamics and oxygen metabolism of the mouse brain. In particular, ffPAM has achieved a 1D time-resolved imaging rate of 500 kHz for morphological imaging and 100 kHz for blood oxygenation imaging.
We recently proposed a novel approach, called ultraviolet-localized mid-infrared (MIR) photoacoustic microscopy (ULM-PAM), to achieve high-resolution and nearly water-background-free MIR imaging of fresh biological samples. In our approach, a pulsed mid-MIR laser thermally excites the sample at a focal spot, and a confocal pulsed ultraviolet laser beam photoacoustically detects the resulting transient temperature rise, thereby reporting the magnitude of the MIR absorption by the sample. This detection scheme is based on the fact that a temperature rise in a sample enhances photoacoustic signals, a phenomenon called the Grüneisen relaxation effect. While our imaging method reveals MIR absorption contrast, its lateral resolution is determined by the ultraviolet wavelength, which is one order of magnitude shorter than the MIR wavelength. In addition, ultraviolet light in the range of 200–230 nm is highly absorbed by most biomolecules, such as lipids, proteins and nucleic acids, but it is totally transmissive in water. Thus, the strong water background of MIR absorption is suppressed in our method. For cultured cells, our method achieves water-background suppressed MIR imaging of lipids and proteins at ultraviolet resolution. Label-free histology using this method is also demonstrated in thick brain slices. Our approach provides convenient high-resolution and high-contrast MIR imaging, which can benefit the diagnosis of fresh biological samples.

The somatosensory regions of both hemispheres was imaged at a volumetric rate of 1 Hz. Fractional PA amplitude changes (shown in yellow), in response to the left hindlimb stimulation (LHS) and right hindlimb stimulation (RHS), were superimposed on the vascular image (shown in red). The curve at the bottom of the video shows the average PA signal amplitude in the somatosensory regions.

Left panel: sO2 map of the somatosensory region of the right hemisphere, acquired at a volumetric rate of 1 Hz. Right panel: close-up of the core responding region, marked by the dashed box in the left panel. The curve at the right bottom of the video shows the average sO2 in the close-up region. Note that the resting-state frames acquired between 120 seconds and 200 seconds are omitted in the video.

a,b, ULM-PAM images of lipids (a) and proteins (b). T, tubular structures; N, nucleic region. c, UV-PAM image of nucleic acids. d,e, MIR-PAM images of lipids (d) and proteins (e), imaged at 3,420 nm and 6,050 nm, respectively. f, Comparison of line profiles along the dashed lines in the ULM-PAM lipid (a), ULM-PAM protein (b), MIR-PAM lipid (d) and MIR-PAM protein (e) images. g, Composite image of a cell formed by overlaying the images of lipids (a), proteins (b) and nucleic acids (c) in different colour channels. h,i, Composite images of the cells at neonatal (h) and mature (i) stages. AB, actin bundle. Scale bars, 10 µm
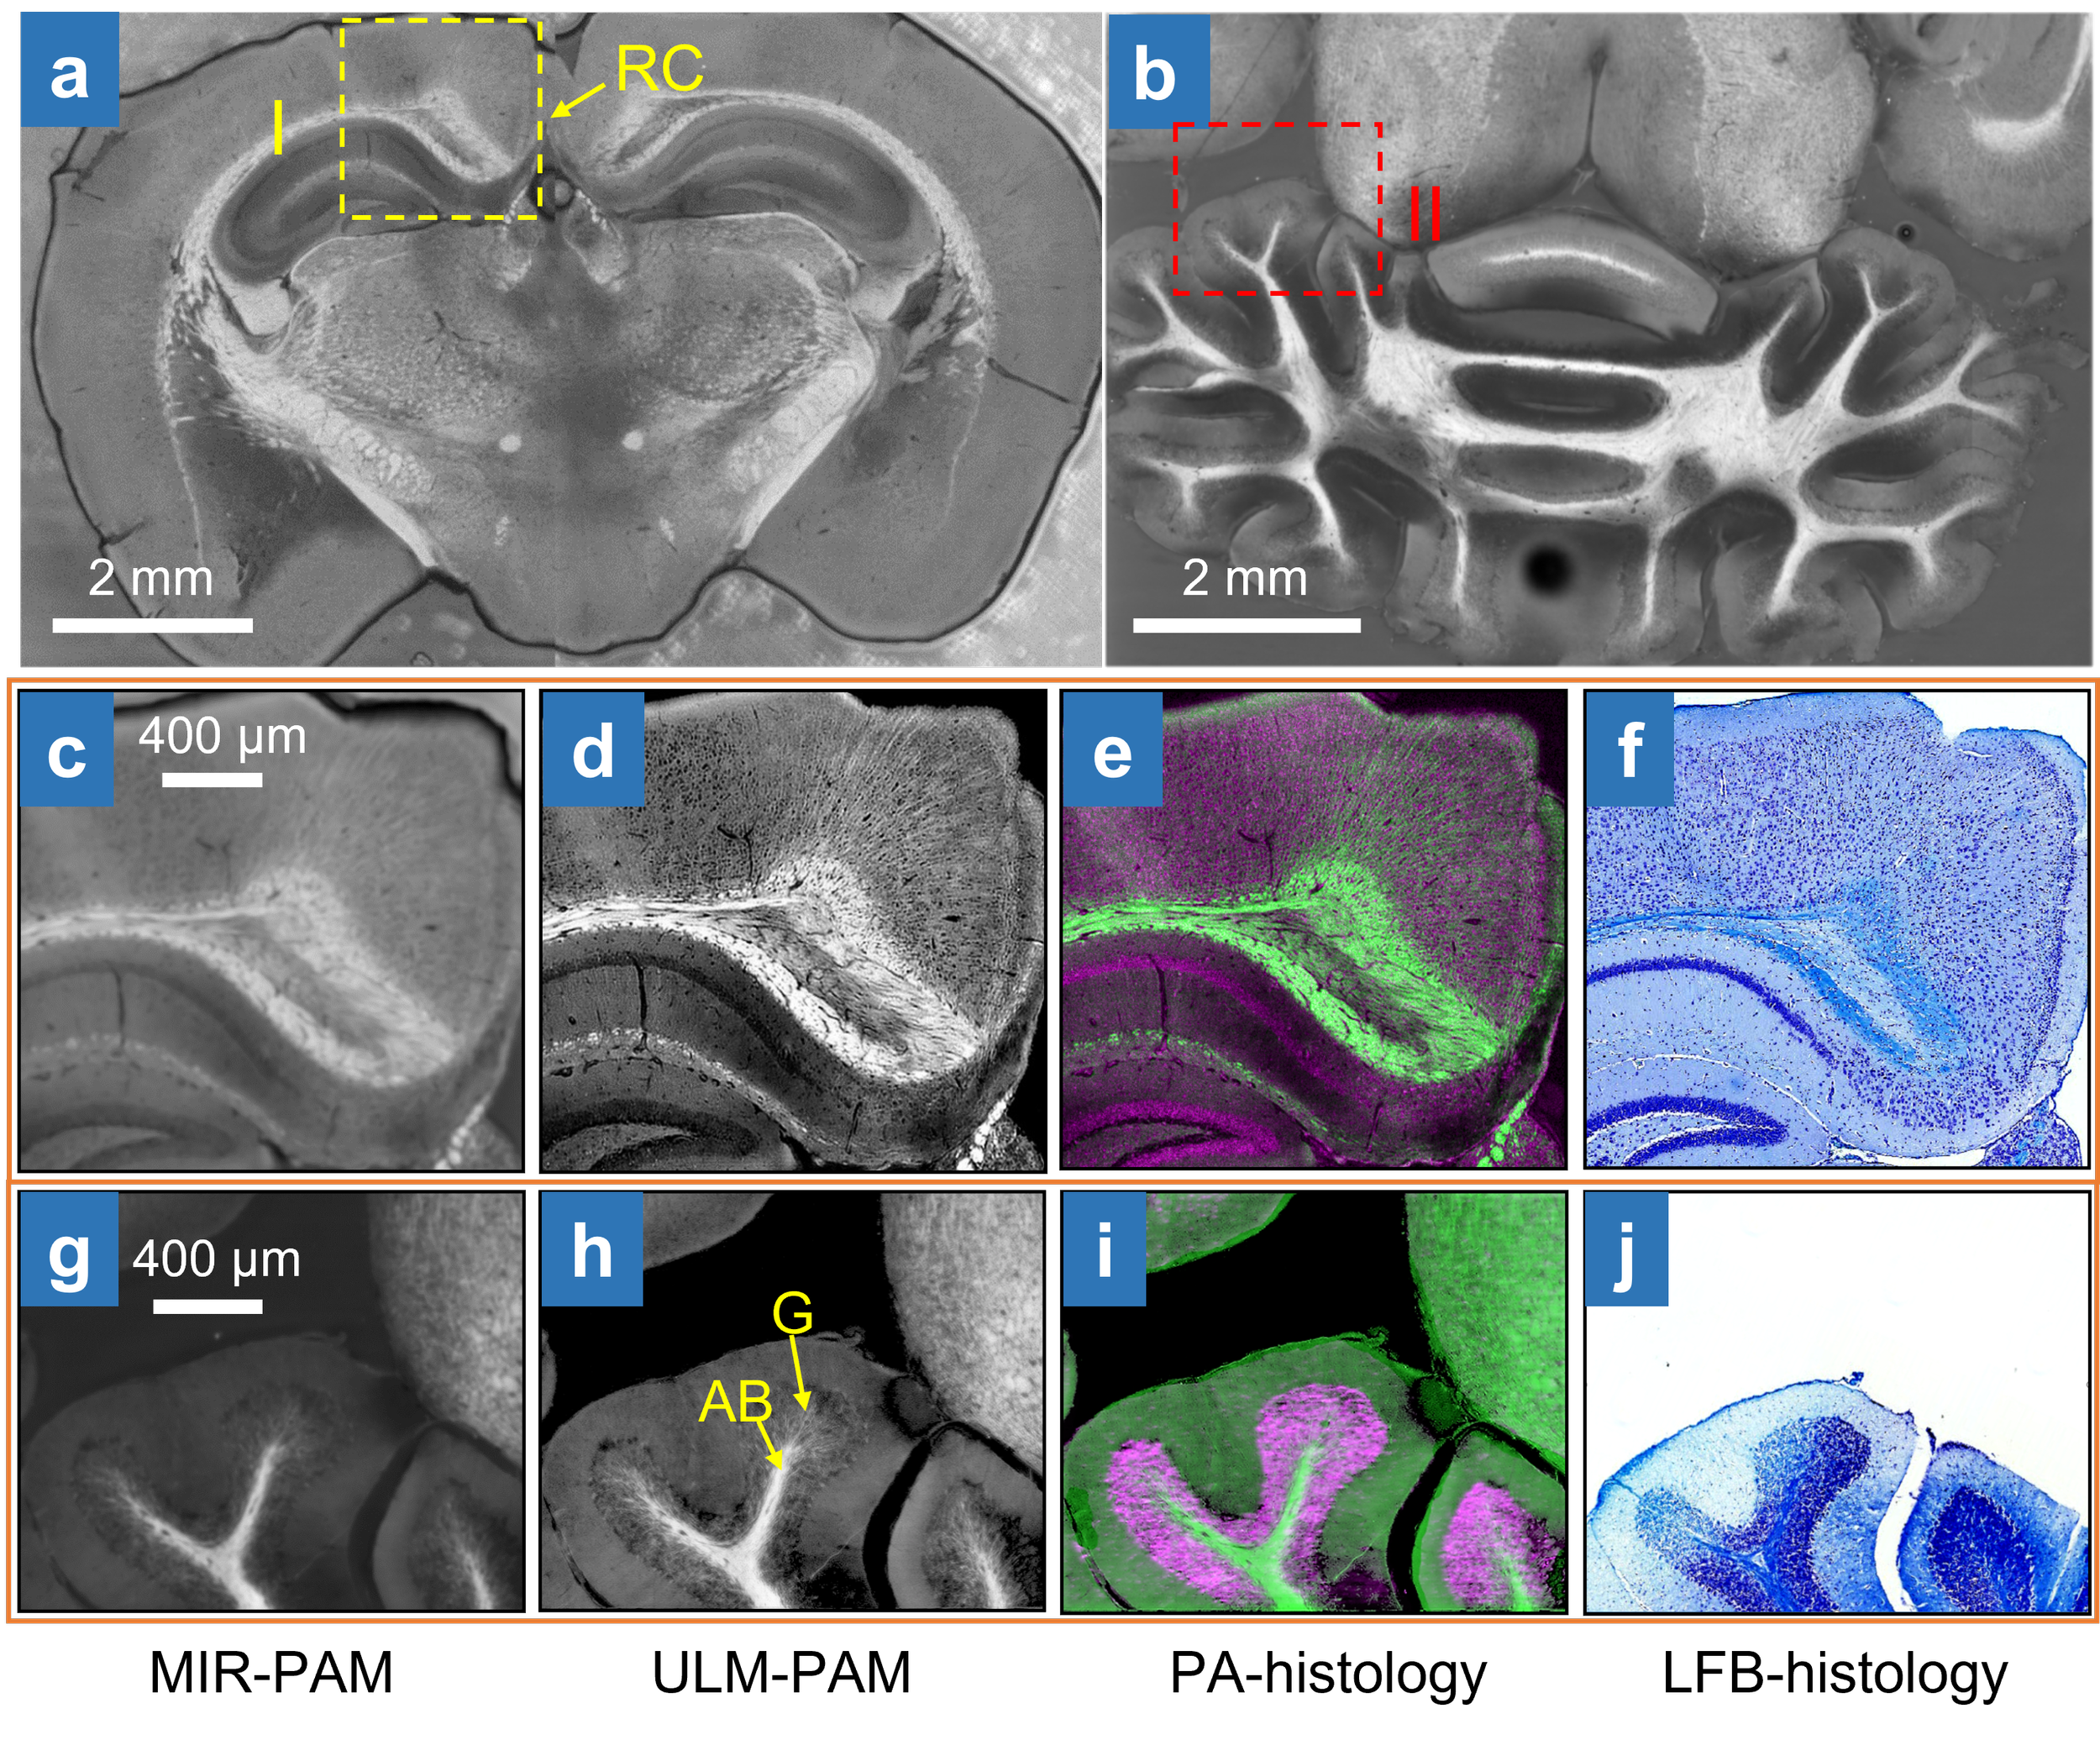
a,b, MIR-PAM images of myelin in slices of the cerebrum (a) and cerebellum (b). RC, retrosplenial cortex. c, Close-up image of myelin. d, ULM-PAM image of myelin. e, PA histology image. f, LFB-stained histology image of the same area (I) in (a). g, Close-up MIR-PAM image of myelin. h, ULM-PAM image of myelin. AB, arbor vitae region; G, granular region. i, Photoacoustic histology image. j, LFB-stained histology image of the same area (II) in (b). In the photoacoustic histology images, green represents myelin and violet represents nucleic acids. In the LFB-stained histology images, blue represents myelin and deep blue represents nucleic acids.